Hen's egg is one of the most frequent causes of adverse reactions to food in children (Bernhisel-Broadbent et al. 1994, Crespo et al. 1995) and adults (Nørgaard & Bindslev-Jensen 1992, Wüthrich 1993). Symptoms are often due to accidental ingestion of hidden food allergens (Yman et al. 1994, Moneret-Vautrin & Kanny 1995). Elucidation of allergic reactions has shown to be more frequently caused by egg white than egg yolk (Wüthrich 1981, Anet et al. 1985). Ovomucoid (OM), ovalbumin (OA), ovotransferrin (OT) and lysozyme (LY) were identified as major allergens in egg white protein (Langeland 1982, Langeland & Harbitz 1983, Hoffman 1983, Holen & Elsayed 1990). Most studies of the last few years have focused on allergenic structures of OA (Kahlert et al. 1992, Elsayed 1993, Honma et al. 1996), which is the main protein of egg white making up 54% of total protein content.
Recently OM has been reported to be the dominant allergen of egg white in egg-allergic children (Bernhisel-Broadbent et al. 1994, Urisu et al. 1997). OM is a glycoprotein with a molecular mass (Mr) of approximately 28.0 kDa and comprises about 11 % of total egg white proteins (Awade 1996, Lin & Feeney 1972). It consists of 186 amino acids forming three tandem domains, each providing trypsin inhibitory activity (Kato et al. 1987). The carbohydrate moieties of OM present up to 22-29% of the Mr. Recently it was demonstrated that the carbohydrate moieties have no impact on the IgE-binding of OM (Besler et al. 1997). Cooke & Sampson (1997) identified 5 IgE binding regions using synthetic peptides of OM. Several immunogenic studies of peptides derived by chemical or enzymatic fragmentation of OM have been done by different groups using specific mouse IgE or rabbit anti-OM sera (Kurisaki et al. 1981, Matsuda et al. 1985a, 1985c). However, detailed studies of human IgE reactivity to peptides derived from native OM are still missing.
The aim of the present study was to identify IgE binding sites on the protein backbone of OM by means of chemically and enzymatically derived peptides.
Human sera
All human sera were RAST class >(=) 3 when tested for
specific IgE against egg-white extract by CAP-RAST (Pharmacia, Uppsala,
Sweden). The 6 sera and the pooled serum showed strong IgE-binding to purified
native OM in SDS-PAGE / immunoblot experiments as previously described
(Besler et al. 1997). The pooled serum was collected using equal aliquots
of 10 sera. A serum from a non-atopic individual with no history of food
hypersensitivity (RAST class 0) was used as negative control.
Purification of ovomucoid
OM (trypsin inhibitor from hen's egg white) was purchased
from Fluka (Buchs, Switzerland) and purified by size exclusion chromatography
(SEC) following ion exchange chromatography (IEC) as desribed before (Besler
et al. 1997). Briefly, IEC was performed using a Resource Q column (1 ml,
Pharmacia) applying 10 mg of crude OM per run. Eluent was 20 mM Tris /
HCl (pH 8.0) with a salt gradient from 0 to 0.5 M NaCl. Detection wavelength
was 280 nm. Collected fractions were further purified by SEC in 50 mM Na2HPO4
/ 0.15 M NaCl / HCl (pH 7.0) on a Sephacryl S-100 HR column (C 26/100,
Pharmacia). Eluted fractions were desalted and concentrated by ultrafiltration
using Centriplus Concentrators (Amicon, Beverly, MA, USA) with 10 kDa cut
off membrane. Resulting solutions (final volume of 300 - 500 µl in
double distilled water) were stored until use at -20°C. The protein
contents of purified OM solutions were determined by the method of Lowry
et al. (1951). Purity was controlled by SDS-PAGE / immunoblot and
capillary zone electrophoresis (Besler et al. 1997).
Cleavages of ovomucoid
For each of the following cleavage methods 625 µg
(22 nmol) of purified OM were used. Cyanogen bromide cleavage of OM was
performed according to Kahlert et al. (1992) in 70 % (v/v) formic acid
(750 µl) for 15 h at room temperature. The applied OM / cyanogen
bromide ratio was 1:40 (w/w) using cyanogen bromide dissolved in acetonitrile
(0.5 g/ml). The enzymatic cleavages were carried out with enzyme / substrate
ratios of 1:10 (w/w) in volumes of 500 µl for 15 h at 37°C. OM
cleavage with pepsin from porcine stomach mucosa (Merck, Darmstadt, Germany)
was performed in 5 % (v/v) acetic acid. Prior to hydrolysis with tosyl-L-phenylalanine-chloromethylketon-treated
trypsin (Typ XIII from bovine pancreas, Sigma) and thermolysin (from Bacillus
thermoproteolyticus, Merck) the enzymes were activated in 100 mM ammonium
bicarbonate buffer containing 24 mM calcium chloride for 2 h at room temperature.
Both cleavages were performed in 100 mM ammonium bicarbonate buffer (Wilkinson
1986). All cleavage reactions were stopped by freezing the reaction vials
in liquid nitrogen. Then cleavage products were lyophylized and stored
at -20°C. Prior to electrophoresis cleavage products were dissolved
in 100 µl sample buffer.
SDS-PAGE
SDS-PAGE was performed in slab gels (200 mm high, 120
mm wide, 1.0 mm thick). Stacking gel (pH 6.8): 5% T, 3% C, 0.125 M Tris,
0.1 % SDS and 30 % (w/v) glycerol. A linear acrylamide gradient was utilized
for the resolving gel modified according to Fling & Gregerson (1986).
Resolving gel (pH 8.8): 20-30% T, 3% C, 0.75 M Tris, 0.1% (w/v) SDS and
20-0% (w/v) glycerol. Electrode buffers (pH 8.3) contained 0.05 M Tris,
0.1 % (w/v) SDS and 0.192 M glycine. Samples dissolved in Tris-HCl / SDS
sample buffer (pH 6.8) containing 2 % (w/v) b-mercaptoethanol and 0.01
% (w/v) Coomassie blue R-250 as migration marker were boiled for 5 min.
Applying 125 µg sample/cm, electrophoresis was performed at 200 V
for 0.5 h and 400 V constant voltage for 18 h at 15°C on a Multiphor
II horizontal slab electrophoresis unit (Pharmacia LKB) with a MultiDrive
XL power supply (Pharmacia LKB). Molecular mass marker proteins in the
range of 2.5 to 17 kDa (protein standard mixture I, Merck, Darmstadt, Germany)
and 14 to 94 kDa (LMW electrophoresis calibration kit, Pharmacia) were
used. Gels were silver stained according to Morissey (1981) or peptides
were electrotransferred to blotting membranes.
Immunostaining
Immunostaining was carried out after electrotransfer
of peptides from slab gels onto nitrocellulose (NC membrane 0.2 µm,
Schleicher & Schuell, Dassel, Germany) at 0.8 mA/cm2 for
75 min using a NovaBlot semidry blotting apparatus (Pharmacia). The discontinuous
electrotransfer buffer system described by Vieths et al. (1992)
was used. Afterwards the membrane was dried for 30 min and cut into strips.
Immunostaining of IgE was performed as described previously by Möller
et al. (1997). Briefly, dried membrane strips were blocked twice
(15 min) in phosphate buffered saline (PBS) containing 0.3 % (v/v) Tween
20 and incubated overnight with 1 ml of each serum diluted 1:10 in PBS
containing 0.3 % (w/v) bovine serum albumin (BSA) and 0.1 % (v/v) Tween
20 at room temperature. Then strips were incubated consecutively with rabbit
anti-human-IgE (1:4000, DAKO, Copenhagen, Denmark), biotinylated goat anti-rabbit-IgG
(1:6000, DAKO) for 1 h each and with streptavidin-horseradish-peroxidase
(1:20000, Medac, Hamburg, Germany) for 20 min. 3,3',5,5'-tetramethylbenzidine
and dioctylsodiumsulfosuccinate were used as substrates for staining. Protein
staining was performed using India Ink according to Hancock & Tsang
(1983).
Amino acid sequence analysis
Automated Edman degradation of peptides was performed
using a 473 A pulse liquid sequencer (Applied Biosystems, CA, USA). 250
µg (9 nmol) cleavage products of OM were separated by SDS-PAGE. After
electrophoresis, gels were equillibrated in CAPS-electrotransfer buffer
(10 mM 3-[cyclohexylamino]-1-propanesulfonic acid, 10 % (v/v) methanol,
pH 11) for 15 min. Prior to use PVDF-membranes (Immobilon-P-membrane, Serva,
Heidelberg, Germany) were rinsed with methanol, water (5 min) and electrotransfer
buffer (15 min) (Ward et al. 1990). Electrotransfer conditions were the
same as described above. Proteins were stained by 0.1 % (w/v) Coomassie
blue R-250 in 50 % (v/v) methanol and 10 % (v/v) acetic acid for 5 min
and destained with 50 % (v/v) methanol in 10 % (v/v) acetic acid. Blotting
membranes were air-dried and stored at room temperature under dry conditions.
Stained peptides were cut out and arranged in the cartridge block of the
sequencer. Since the amino acid sequence of OM is known, the analysis of
5 to 11 amino acids was sufficient for identification of the peptides.
Antigenicity prediction of sequential epitopes
Computer analysis for antigenicity prediction was performed
using ANTHEPROT V4.0 software by G. Deleage (Lyon, France, http://www.ibcp.fr).
Three different algorithms using the primary amino acid sequence data were
applied: a) the hydrophilicity method as described by Hopp & Woods
(1981), b) combined antigenicity profile by Parker et al. (1986) and, c)
antigenicity method by Welling et al. (1985). The averaged propensities
were calculated onto a sliding window of 7 amino acids.
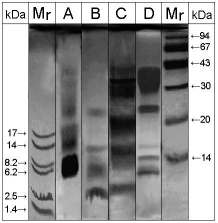
Figure. 1: SDS-PAGE / silver
staining of OM peptides derived from different cleavages. Lane
A: Cyanogen bromide cleavage, lane B: pepsin cleavage, lane C: thermolysin
cleavage, lane D: trypsin cleavage, Mr: molecular mass marker proteins.
Cyanogen bromide cleavage of Ovomucoid
Four cleavage products were obtained by cyanogen bromide cleavage of
OM as determined by SDS-PAGE silver staining (Fig.1). These peptide bands
were broad shaped and migrated according to Mr of approximately 23, 18,
14 to 16 and 6 to 10 kDa, respectively (Tab.1). All four fragments were
detected by immunostaining. Four and six out of six patients' sera from
egg allergic individuals showed strong IgE-binding to fragments CNBr-3
and CNBr-4, respectively. Whereas only one and three sera showed weak binding
to fragments CNBr-1 and CNBr-2, respectively (Tab.1, Fig.2). The N-termini
of three peptides (CNBr-2 to CNBr-4) turned out to be identical as determined
by amino acid sequencing (Tab.1). The identified amino acids were consistent
with the internal sequence 85-90 (V-L-C-N-R-A) of OM. Cleavage occured
at Met-84.
|
|
Mr (kDa) | Silver staininga | Immuno-
stainingb |
Amino acid
sequencec |
| native OM | 30-45 | +++ | 6 | n.d. |
| remaining OM | 30-45 | + | 1 | n.d. |
| CNBr-1 | ~ 23 | + | 1 | n.d. |
| CNBr-2 | ~ 18 | + | 3 | V-L-?-N-R-A |
| CNBr-3 | 14-16 | ++ | 4 | V-L-?-N-R-A |
| CNBr-4 | 6-10 | +++ | 6 | V-L-?-N-R-A |
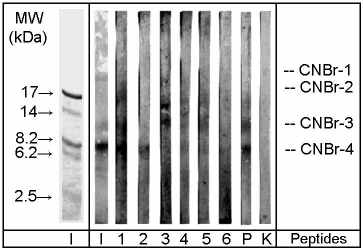
Figure 2: SDS-PAGE / immunoblot
of OM peptides derived from cyanogen bromide cleavage. Immunostaining:
1-6 patients' sera, P pooled serum, K negative control serum. Protein staining:
I indian ink, Mr: molecular mass marker proteins. CNBr-1 to CNBr-4: OM
peptides derived by cyanogen bromide cleavage.
Pepsin cleavage of Ovomucoid
According to SDS-PAGE/silver staining OM was totally degraded by cleavage
with pepsin (Fig.1). However, besides the detection of all four cleavage
products by silver and immunostaining OM was detected in immunostaining
by one serum (Tab.2, immunostains only visible on originals). The amino
acid sequence of fragment PE-1 corresponded to the internal sequence 50-55
(F-G-T-N-I-S) (Tab.2). The occurring substitution of N by D may be due
to a desamidation of N. The fragment PE-3 corresponded to the internal
sequence 134-139 (V-S-V-D-C-S) (Tab.2). The amino acid sequencing of PE-2
resulted in two overlapping N-termini. The internal sequences 1-11 (AEVDCSRFPNA)
and 134-143 (VSVDCSEYPK) could be identified by the different concentrations
and comparison with the known primary structure of OM, respectively (Tab.2).
|
|
Mr (kDa) | Silver staininga | Immuno-
stainingb |
Amino acid
sequencec |
| native OM | 30-45 | +++ | 6 | n.d. |
| OM | 30-45 | - | 1 | n.d. |
| PE-1 | 23.5 | + | 2 | F-G-T-D-I-S |
| PE-2 | 14 | +++ | 2 | 1) AEVD?SRFPNA
2) VSVD?SEYPK |
| PE-3 | 6-8 | ++ | 2 | V-S-V-D-?-S |
| PE-4 | 3.5 | ++ | 1 | n.d. |
Table 3: Thermolysin cleavage of OM. Results of
SDS-PAGE separated cleavage products including remaining OM in comparison
with native OM.
|
|
Mr (kDa) | Silver staininga | Immuno-
stainingb |
Amino acid
sequencec |
| native OM | 30-45 | +++ | 6 | n.d. |
| remaining OM | 30-45 | ++ | 4 | n.d. |
| TH-1 | 19-22 | ++ | 2 | I-S-K-E-H |
| TH-2 | ~13.5 | ++ | 1 | n.d. |
| TH-3 | ~3.5 | ++ | 0 | n.d. |
Thermolysin cleavage of Ovomucoid
As estimated by SDS-PAGE/silver staining OM was degraded
only partially by thermolysin (Fig.1). Three fragments were detected at
Mr of ~3.5, ~13.5 and 19-22 kDa (Tab.3). Fragments TH-1 and TH-2 showed
weak IgE binding from two and one patients' sera in SDS-PAGE/immunoblot,
respectively. TH-3 did not bind IgE from any serum (Tab.3, immunostains
only visible on originals). The N-terminal sequence of TH-1 matched the
internal sequence 54-58 (I-S-K-E-H) of OM. Thermolysin cleaved OM behind
Asp-53.
Trypsin cleavage of Ovomucoid
OM was cleaved incompletly by trypsin as shown by SDS-PAGE/silver
staining (Fig.1). Nevertheless five cleavage products were obtained. Four
of them were detected by silver staining, while the fifth could only be
visualized by immuno staining (Fig.3). All fragments bound IgE from patients'
sera. Five out of six sera reacted with TR-3 (Mr 10.5 kDa), four sera with
TR-1 (24 kDa) and TR-4 (7-8 kDa), three sera with TR-2 (14.5 kDa) and two
sera with TR-5 (2.5 kDa). All analyzed fragments (TR-2 to TR-5) showed
the same N-terminal sequence (Tab.4). They corresponded to the internal
sequence 90-94 (A-F-N-P-V) of OM. The cleavages occured at Arg-89.
|
|
Mr (kDa) | Silver staininga | Immuno-
stainingb |
Amino acid
sequencec |
| native OM | 30-45 | +++ | 6 | n.d. |
| remaining OM | 30-45 | +++ | 5 | n.d. |
| TR-1 | 24 | +++ | 4 | n.d. |
| TR-2 | 14.5 | + | 3 | A-F-N-P-V |
| TR-3 | 10.5 | ++ | 5 | A-F-N-P-V |
| TR-4 | 7-8 | ++ | 4 | A-F-N-P-V |
| TR-5 | 2.5 | - | 2 | A-F-N-P-V |
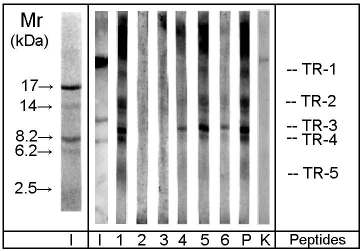
Figure 3: SDS-PAGE / immunoblot of OM peptides derived from trypsin cleavage. Immunostaining: 1-6 patients' sera, P pooled serum, K negative control serum. Protein staining: I indian ink, Mr molecular mass marker proteins. TR-1 to TR-5: OM peptides derived from trypsin cleavage.
Antigenicity prediction of sequential epitopes
Computer analysis using the method of Hopp & Woods
(1981) demonstrated at least five putative antigenic regions on the primary
structure of OM, while the antigenicity profiles by Parker et al. (1986)
and by Welling et al. (1985) predicted at least six antigenic regions (Fig.
4). The best agreement with each other was found for the algorithms of
Hopp & Woods (1981) and Parker et al. (1986). Hydrophylicity and antigenicity
peaks showed an overlapp of 44%. The methods of Hopp & Woods (1981)
and Welling et al. (1985) agreed to an extent of 36%. 25% agreement was
shown by the methods of Parker et al. (1986) and Welling et al. (1985).
Cleavage Pattern of OM fragments in SDS-PAGE
OM contains two Met-residues, therefore three fragments of OM could
be expected cleaving with cyanogen bromide which is specific for Met. The
three fragments are referring to the sequences 1-68 (Mr 7453 Da), 69-84
(Mr 1705 Da) and 85-186 (Mr 10954 Da), respectively (calculated Mr of the
peptide chain without carbohydrate moieties). Beeley (1976a) obtained three
fragments with Mr of 12, 11 and, 4.7 kDa, respectively. Whereas Kurisaki
et al. (1981) identified two fragments after cyanogen bromide cleavage
of OM referring to the sequences 1-68 and 69-186. In the present study
four fragments were obtained by cyanogen bromide cleavage. The fragments
CNBr-2, CNBr-3 and CNBr-4 showed the same N-terminus cleaved behind Met-84,
but had different electrophoretical mobilities in SDS-PAGE experiments.
Due to the absence of Trp-residues (which is reported to cause the only
known side reaction of cyanogen bromide cleavage, Fontana & Gross 1986)
in OM and the absence of Met-residues in the sequence 85-186 it was concluded,
that all three fragments represent the sequence 85-186. Acidic hydrolysis
was excluded by control without cyanogen bromide. The different mobilities
of the fragments could be due to by conformational differences e.g. variable
glycosylation sites or only partial reduction of the five disulfide bonds
located on the sequence 85-186.
The pattern of OM cleavage with pepsin was in good agreement with the results described by Matsuda et al. (1985a, 1985c). They found four fractions separated by SEC with Mr of 25, 18, 13 and, 2 kDa, respectively. Differences in Mr of the fragments are due to the different methods used for Mr estimation (SEC and SDS-PAGE, respectively). Beeley (1976b) separated nine fractions after trypsin cleavage of OM by SEC, while Yet et al. (1988) isolated four fractions. None of the five trypsin cleavage fragments we characterized in this study matched the N-terminus of one of the fractions found by Beeley (1976b) and Yet et al. (1988), respectively. In contrast the fragments identified by Kato et al. (1987) after trypsin cleavage of OM contained the sequences 1-89 and 90-186, which were also present in the fragments TR-1 and TR-2 to TR-5, respectively.
IgE-binding Epitopes
A total of 10 IgE-binding peptides derived from OM cleavage were identified
by their N-terminal amino acid sequence. Three fragments obtained after
cyanogen bromide cleavage and four fragments after trypsin treatment revealed
identical N-termini, respectively. Thus in total five different N-terminal
sequences of IgE-binding fragments of OM could be identified (Tab.5). Three
N-termini were located on domains I (1-68) and II
(65-130), while two N-termini were located on domain
III (131-186) (Tab.5 and Fig.6). All five sequences
were in agreement with antigenic fragments described by Beeley
(1976 a), Kurisaki et al. (1981), Konishi et al. (1982) and Matsuda et
al. (1985 a, c) using antibodies of animal origin. Binding of human IgE
was described for the three isolated domains only (Matsuda et al.1985b,
1986, Cooke & Sampson 1997), but not for chemical or enzymic peptide
mapping of OM.
| No.
in Fig. 5 |
N-Termini | Fragments | Mr (kDa) | Cleavages |
| 1 | 50-55 | PE-1 | 23.5 | Pepsin |
| 2 | 54-58 | TH-1 | 19-22 | Thermolysin |
| 3 | 85-90 | CNBr-2, -3, -4 | 6-18 | Cynogen bromide |
| 4 | 90-94 | TR-2, -3, -4, -5 | 2.5-14.5 | Trypsin |
| 5 | 134-139 | PE-3 | 6-8 | Pepsin |
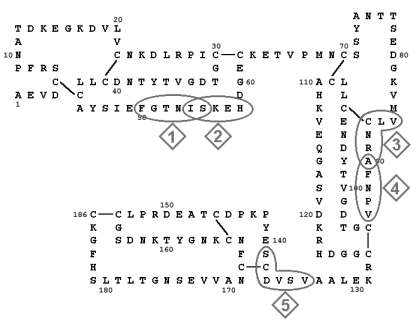
Figure 5: Amino acid sequence
of OM: N-termini of IgE binding peptides. Identity
of peptides 1 to 5 referring to Tab.5.
As discussed above all three fragments of the cyanogen bromide cleavage represented the sequence 85-186 of OM. Thus smaller IgE-binding regions could not be identified by cyanogen bromide cleavage (Tab.5, No.3). For the location of IgE-binding epitopes on trypsin derived peptides the smallest peptide TR-5 (N-terminus 90-94) was considered to be most important (Tab.5, No.4). Assuming the C-terminus of TR-5 resulted by the most probable trypsin cleavages at Lys-113 and Lys-122 the Mr of the sequences 90-112 or 90-121 were calculated to be 2468 Da and 3399 Da, respectively (Fig.5, No.4). It could not be deduced which of both sequences was obtained, because SDS-PAGE is not sufficient for exact Mr determination. Therefore it was concluded that an important IgE-binding epitope is certainly located on the protein region 90-121.
The fragments PE-1 (N-terminus 50-55) and TH-1 (N-terminus 54-58) with 23.5 and 19-22 kDa in SDS-PAGE, respectively, correspond to the regions 50-186 and 54-186. With regard to the glycosylation sites Asn-53, -69, -75 and, -175 (each accounting an average Mr of 1.8 kDa according to Yet et al. 1988) the sequence 50-186 had a calculated Mr of 22.0 kDa, while the sequence 54-186 had a Mr of 19.8 kDa. The Mr of 6-8 kDa of the fragment PE-3 corresponded to the sequence 134-186 with calculated Mr about 4.2 kDa and 6.0 kDa (taking the glycosylation site Asn-175 into account). Therefore we assumed no further cleavages between Val-134 and the C-terminus of OM. In summary at least two distinct IgE-binding epitopes located on the protein regions 90-121 and 134-186 were identified. In contrast to IgE binding studies utilizing synthetic or recombinant peptides these regions represent the native structure of OM. This is important regarding posttranslational modifications, particularly the high degree of glycosylation. Furthermore chemically and enzymatically derived peptides should represent the 3D-structure of the native protein better than shorter synthetic peptides.
Cooke & Sampson (1997) used synthetic dodeca peptides with overlapping sequences of 10 amino acids in order to analyze the whole sequence of OM. They described five IgE and six IgG binding epitopes using a pooled serum from egg allergic patients in immunoblot experiments. Four of the N-terminal sequences determined in the present study were in agreement with IgE binding epitopes described by Cooke & Sampson (1997). The epitope 49-56 identified by Cooke & Sampson (1997) is represented in our study by the fragment PE-1. The epitope 85-96 corresponds to the N-terminal sequence of fragments CNBr-2 to CNBr-4, while the fragment TR-5 overlaps with the epitope 115-122. Fragment PE-3 contains the epitope 175-186. The fifth IgE binding epitope 1-20 described by Cooke & Sampson (1997) could not be represented in our study.
Antigenicity prediction of sequential epitopes
All three antigenicity prediction methods demonstrated
peaks located inside the two smallest IgE binding regions presented in
this study (Fig.6). The highest agreement was demonstrated by the combined
antigenicity profile (Parker et al. 1986), which shared 50% of the region
OM 90-121 and 47% of the region OM 134-186. The methods of Hopp & Woods
(1981) and Welling et al. (1985) encompassed 34% and 38% of OM 90-121 as
well as 42% and 45% of OM 134-186, respectively.
In comparison with the epitopes presented by Cooke &
Sampson (1997) antigenicity peaks of the Parker et al. (1986) method were
located inside four out of five IgE binding epitopes and inside all the
six IgG binding epitopes. Whereas the peaks of the other two prediction
algorithms were located inside three out of five IgE binding epitopes and
inside five out of six IgG binding epitopes. Accounting the overlap of
antigenicity peaks with IgE and IgG binding regions of OM correct prediction
was achieved by 46% (Parker et al. 1986), 37% (Hopp & Woods 1981) and,
36% (Welling et al. 1985), respectively. False epitope prediction was about
28% (Parker et al. 1986, Welling et al. 1985) and, 38% (Hopp & Woods
1981), respectively. These results are in agreement with several other
studies, who described probabilities for correct epitope prediction about
45% (Ferreira da Cruz et al. 1996) and 50-60% (Van Regenmortel & Pellequer
1994). Moreover these algorithms are based on the primary amino acid sequence
taking no posttranslational modifications into account.
At least two distinct IgE binding epitopes located on peptides derived from native OM were identified. The results obtained by means of chemical and enzymic cleavage of OM are equivalent to epitope mapping using synthetic peptides. In summary OM is a well characterized allergen with regard to it's B-cell reactivity. Future investigations should focus on the T-cell responsiveness of OM regions to provide further knowledge of the mechanisms of egg white allergy. The antigenicity prediction algorithms used in this study were of low value for correct epitope prediction.
ACKNOWLEDGEMENT
We would like to thank D. Vieluf (Hospital Borkum Riff,
Germany) for providing human sera. Special thanks to S. Bruns, H. Neuhoff
and O. Zube for their technical support.