Hen's egg is one of the most frequent causes of adverse reactions to food. The prevalence of egg allergy is about 35% in food allergic children and children with atopic dermatitis, respectively (Crespo et al. 1995, Resano et al. 1998). The prevalence could be up to 73% in DBPCFC- positive children with atopic dermatitis (Sampson & Ho 1997), whereas frequency of egg allergy in food allergic adults is about 12% (Wüthrich 1993). Egg was the cause of anaphylactic shocks in 11.6% of cases due to ingestion of foods (Moneret-Vautrin & Kanny 1995). Elucidation of allergic reactions showed that they were more frequently caused by egg white than egg yolk (Wüthrich 1981, Anet et al. 1985). Ovomucoid (OM), ovalbumin (OA), ovotransferrin (OT) and lysozyme (LY) were identified as major allergens in egg white protein (Langeland 1982, Langeland & Harbitz 1983, Hoffman 1983, Holen & Elsayed 1990). The properties of the four major allergens from egg white are shown in Tab. 1.
The dominant allergen of egg white in egg- allergic individuals
is OM (Bernhisel-Broadbent et al. 1994, Urisu et al. 1997). OM is a glycoprotein
with a molecular mass (Mr) of approximately 28.0 kDa and comprises about
11% of total egg white proteins (Awade 1996, Lin & Feeney 1972). It
consists of 186 amino acids forming three tandem domains (designated DI,
DII, and DIII) each providing trypsin inhibitory activity (Kato et al.
1987). The carbohydrate moieties of OM present up to 22-29% of the Mr.
The present paper presents an overview of isolation and purification procedures
of OM from egg white and reviews the molecular biological and allergenic
properties of OM.
Tab. 1: Major Egg White Allergens
| Allergen | Ovomucoid | Ovalbumin | Ovotransferrin | Lysozyme |
| Nomenclature | Gal d 1 | Gal d 2 | Gal d 3 | Gal d 4 |
|
|
|
|
|
|
| Content (2) | 11 % | 54 % | 13 % | 3.5 % |
| Mr [kDa] | 28.0 | 45.0 | 77.7 | 14.3 |
| pI | 4.1 | 4.5 | 6.0 | 10.7 |
| Amino Acids | 186 | 385 | 686 | 129 |
| Carbohydrate | ~ 25 % | ~ 3 % | 2.6 % | 0 % |
| Biological Function | Serin-Protease-
Inhibitor |
Serpin-Family | Fe-Transport
bacteriostatic |
1,4-beta- N-Acetyl- muramidase C |
ISOLATION AND PURIFICATION OF OVOMUCOID
IEC/SEC-Purification
Effective purification of OM was demonstrated by Ebbehøj et
al. 1995 and Besler et al. 1997 (Fig. 1, Fig. 2). A two step chromatographic
procedure of combined IEC/SEC was recommended. It could be concluded from
the detection limits of silver staining, CIE and capillary zone electrophoresis
that OM was highly purified. Contents of cross- contaminating proteins
were less than 0.1% (Ebbhøj et al. 1995, Besler et al. 1997 and
1998).
| Figure 1: Purification of Ovomucoid by IEC. Commercial OM preparation (trypsin inhibitor from hen's egg white) was purified by size exclusion chromatography (SEC) following ion exchange chromatography (IEC) (Besler et al. 1997). IEC was performed using a Resource Q column (1 ml, Pharmacia) applying 10 mg of crude OM per run. Eluent was 20 mM Tris / HCl (pH 8.0) with a salt gradient from 0 to 0.5 M NaCl. Detection wavelength was 280 nm (Besler et al. 1997). | |
| Figure 2: Purification of Ovomucoid by SEC. Fractions collected by IEC were further purified by SEC in 50 mM Na2HPO4 / 0.15 M NaCl / HCl (pH 7.0) on a Sephacryl S-100 HR column (C 26/100, Pharmacia). Eluted fractions were desalted and concentrated by ultrafiltration (Besler et al. 1997). | |
Fraction Collection by Capillary Zone Electrophoresis
LY, OT and OA could be sufficiently separated by CZE. Their fractions
were collected using sodium phosphate separation buffer (pH3.5) containing
0.05% (w/v) polyethylene glycol 35000 (Besler et al. 1998). In this separation
system OM migrated as a broad shaped peak (Besler et al. 1997). Therefore
a formic acid buffer system with lower pH was used, resulting in a sharpened
OM peak which was collected within 7 min (Fig. 4). The fraction of OM was
collected automatically 120 times. Approximately 3 µg of OM were
collected. The re-analysis by CZE showed no impurities from other egg white
proteins (Fig. 3). The experimentally determined amounts of collected OM
corresponded to recovery rates of about 20%. Loss of protein is probably
due to programmed collection width, adsorption to capillary surface and
migration to the cathode during fraction collection using the voltage mode.
The amount of purified OM was sufficient for further off-line analysis
by immunological methods and matrix-assisted laser desorption/ionisation
time of flight (MALDI-TOF) mass spectrometry (Fig. 3, insert). OM could
be identified in the corresponding CE-fraction by MALDI-TOF (CE fraction
28834 m/z, standard 27907 m/z). In dot-blot experiments all spots (standard
and CE fraction of OM) were detected strongly by anti- chicken egg albumin
pAb and to a lesser degree by two pooled sera from egg allergic patients
(Fig. 3, insert).
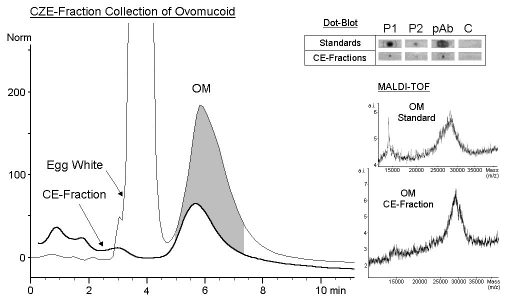 |
| Figure 3: Fraction Collection by Capillary Zone Electrophoresis
CZE: A bare fused-silica capillary (total length 64.0 cm, effective length 55.5 cm, inner diameter 100 µm) was preconditioned between runs by flushing with 0.1 M NaOH (1 min), 0.1 M H3PO4 (1min) and separation buffer (5 min). OM was collected using 100 mM formic acid (pH2.2) as separation buffer. Samples of lyophylized whole egg white (10 mg/ml) were injected by the pressure method (50mbar, 5 sec). Separation was carried out applying 30 kV at 25°C. Detection wavelength was 214 nm. The peak of interest was collected by a programmed method using the voltage mode. Collection width was 10 %. Collection vials contained 40 µl of separation buffer. Separation and fraction collection were performed on an HP3DCapillary electrophoresis system (Hewlett-Packard, Wilmington, DEL, USA) (Besler et al. 1998). MALDI-TOF: Mass spectra of CE fraction and OM standard protein. (Conditions see Fig. 4) Dot-Blot: Immunodetection of dot-blotted CE fraction and purified OM. 10 µl of collected fractions were transferred onto nitrocellulose membranes. Immunostaining was performed as described before (Besler et al. 1997, 1998). P1 and P2 = pooled sera from egg white allergic patients (each 10 sera, RAST >/=3). pAb = anti- chicken egg albumin pAb. C = control serum. |
MOLECULAR BIOLOGICAL PROPERTIES OF OVOMUCOID
Molecular Mass Determination
Figure 4 shows the Mr determination of OM by SDS-PAGE and MALDI-TOF
mass spectrometry.
Differing results were observed in SDS-PAGE (30 to 43 kDa) and MALDI-TOF
(28.0 kDa). These results are in agreement with other authors (Ebbehøj
et al. 1995, Dabich et al. 1993, Burley & Vedehra 1989). Overestimation
of Mr in SDS-PAGE may be due to a low SDS/protein- ratio since carbohydrate
moieties do not bind SDS. The broad shape of OM bands in SDS-PAGE could
be caused by incomplete reduction of the nine disulphide bridges hindering
formation of unique elipsoid SDS-protein-complexes, although acetylation
with iodoacetamide did not improve the shape.
Therefore the exact Mr of OM is given by MALDI-TOF mass spectrometry.
The spectrum showed a heterogeneous mass distribution from 25000 to 31000
m/z. Average Mr of OM was 27992 +/- 233 Da as calculated by the masses
of 2M+, M+, 2M+, and 3M+ molecule ions.
 |
| Figure 4: MALDI-TOF Mass Spectrometry of native and deglycosylated Ovomucoid. Mass spectra of OM and d-OM were obtained using the linear mode on a reflex TOF mass spectrometer (Bruker-Franzen Analytik, Bremen, Germany) equipped with a 337-nm nitrogen laser. In general, 20-50 single shot spectra were added to obtain good signal-to-noise-ratio. The mass spectrometer was calibrated with trypsinogen and carbonic anhydrase. Approximately 60 µg lyophylized OM and d-OM were redissolved in 100 µl of saturated sinapic acid in 50 % acetonitrile containing 0.1 % trifluoroacetic acid. Prior to analysis 10 µl of this solution were dried on the target (Besler et al. 1997). |
Isoelectric Point
Holen & Elsayed (1990) described two isoforms of OM in the pI range
of 4.4-4.6 by IEF-PAGE.
Amino Acid and DNA Sequences
Kato et al. (1987) identified two genetic variants of OM: the major
form comprising all 186 amino acids and a minor form with deletion of a
dipeptide (at Val-134 - Ser-135) estimated to occur in approximately 20%
of OM molecules (Accession No. SWISS-PROT: P01005, GenBank: J00902).
Recombinant domains DI and DIII were expressed in Escherichia coli
systems (Hinck et al. 1993, Kojima et al. 1994, DeKoster & Robertson
1997). However, no allergenic characterization of recombinant domains has
been done to date.
POSTTRANSLATIONAL MODIFICATIONS
Disulfide Bonds
OM comprises 9 disulfide bonds. Each domain of OM is cross- linked
by 3 intradomain disulfide bonds; there are no interdomain disulfide bonds
(Beeley 1976, Kato et al. 1987).
Glycosylation
The carbohydrate moieties of OM present up to 22-29% of the whole Mr
(Beeley 1971). Decrease in Mr after chemical deglycosylation of OM was
about 23 to 26% (MALDI-TOF mass spectrometry, Fig. 5). The main saccharides
of OM are N-Acetylglucosamine (GlcNAc), mannose (Man), galactose (Gal)
and N-acetylneuramic acid (NeuNAc) with about 14 - 16%, 6.5 - 8.5%, 0.5
- 4% and 0.04 - 2.2% of the total Mr, respectively (Beeley 1971). Glycosylation
sites are Asn-10, Asn-53, Asn-69, Asn-75 and Asn-175. There are glycosylated
and non glycosylated isoforms of OM at Asn-175 (Kato et al. 1987). Yamashita
et al. (1983) identified carbohydrate moieties from OM as multi-antennary
complex type oligosaccharides, which were different from OA sugar chains.
Oligosaccharides from OM revealed Mr from 1467 to 2441 Da (Yet et al. 1988).
Biological Function
OM belongs to the kazal family of serin protease inhibitors. All three
domains of OM (DI: 1-68, DII: 65-130, DIII: 131-186) provide trypsin inhibitory
activities (Kato et al. 1987). OM was proven to inhibit bovine rather than
human trypsin (Matsuda et al. 1983).
ALLERGENIC PROPERTIES OF OVOMUCOID
Frequency of Sensitization
The frequency of sensitization to OM in egg allergic patients is summarized
in Fig. 5. Although the frequency of hen's egg allergy is about three times
higher in children than in adults, to date there is no evidence of significant
differences in sensitization pattern to OM and other egg allergens in children
and adults. The results differ considerably with the applied diagnostic
methods. Sensitization frequencies to OM of 34-38% of egg allergic patients
were obtained by immunoblot techniques (dot-immunoblot, SDS-PAGE immunoblot).
While the other tests resulted in higher frequencies of 69-97% (SPT, RAST,
CRIE). These differences may be due to denaturing of OM during the blotting
procedure, which could affect conformational epitopes. Cross- contaminating
proteins of the employed OM preparations could give false results in non-
separating methods like SPT, RAST and dot-blot. Therefore highly purified
allergen preparations should be used for correct diagnosis of sensitization.
No DBPCFC or determinations of minimum amounts inducing symptoms after
ingestion of isolated OM have been performed to date.
| Figure 5: Frequency of Sensitization to Ovomucoid in Egg Allergic Patients | 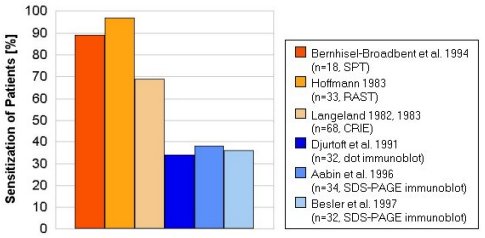 |
IgE-binding of OM Domains
IgE- binding activity of OM is distributed over all 3 domains (Matsuda
et al. 1986). Which domain is immunodominant is still controversial. While
Cooke & Sampson (1997) found predominantly IgE- binding to the second
domain DII, Zhang & Mine (1998) attributed the highest binding activity
to the third domain DIII (Tab. 2). However, the combination of all three
domains may be essential for retaining full IgE- binding activity, since
total reactivity of the three domains was only 55 to 75% as compared to
native OM (Zhang & Mine 1998).
Table 2: Specific IgE- binding to ovomucoid domains (average
percentage*)
|
|
|
|
|
|
|
|
|
|
|
|
|
|
|
|
glycosylated non-glycosylated |
35% < 4% |
- - |
27% 47% |
|
|
(medium percentage) |
(median percentage) |
(medium percentage) |
Influence of Disulfide Bonds
The conformational impact on the IgE- binding activity of OM was examined
either by oxidation with performic acid or reduction and alkylation, both
resulting in the cleavage of disulfide bonds. Results of different studies
were not always consistent with each other. Cooke & Sampson (1997)
found no significant changes in IgE- binding after oxidation of OM, while
IgE- binding of reduced OM was markedly reduced in some patients. Djurtoft
et al. (1991) described the loss of IgE- binding to reduced OM in some
patients, while in others reduced OM still retained its allergenicity.
In contrast Zhang & Mine (1998) described an increase in IgE- binding
of the third domain from OM after reduction and alkylation in some patients.
In summary, the different results implicate an individually varying
impact of alteration of the conformational structure. Sera which predominantly
react to conformational epitopes show reduced IgE- binding to reduced OM,
while sera which predominantly react with sequential epitopes may show
increased IgE- binding to reduced OM.
IgE-binding of Carbohydrate Moieties
Besler et al. (1997) showed that the carbohydrate
moieties of OM had rather no effect on the allergenicity of OM. After removal
of about 98.4% of carbohydrates from OM there were no differences in IgE-
binding of OM and deglycosylated OM in SDS-PAGE / immunoblotting and EAST-
inhibition experiments.
Another approach investigating the glycosylation
site Asn-175 was used by Matsuda et al. (1986) and Zhang & Mine (1998)
giving differing results. Matsuda et al. (1986) isolated the glycosylated
and the non-glycosylated isoforms of the third domain. They found significantly
higher specific serum IgE levels against glycosylated DIII than against
non-glycosylated DIII in 2 egg allergic patients (Tab. 2).
In contrast Zhang & Mine (1998) determined
higher levels of specific IgE against non-glycosylated DIII than against
glycosylated DIII in 9 egg allergic patients, suggesting a rather
inhibiting effect of the carbohydrate moiety on the IgE- binding activity
of the third domain.
Epitope Mapping of the Peptide Chain
After enzymatic cleavage of OM two distinct IgE- binding regions of
32 and 53 amino acids in length (OM 90-121 and OM 134-186) could be identified
on the second and third domain, respectively (Besler et al. 1999). Using
synthetic peptides Cooke & Sampson (1997) identified 5 IgE- binding
epitopes of 7 to 20 amino acids in length. 2 epitopes were located on DI
and DII, each, and 1 epitope on DIII, while Mine & Zhang indentified
7 IgE binding epitopes, 2 epitopes in DI and DII, respectively, and 3 epitopes
in DIII using a SPOTs membrane of overlapping peptides (Mine & Zhang
1999). Figure 6 shows the IgE- binding epitopes on the primary structure
of OM. Furthermore it has been shown that hydrophilic residues are more
critical for human IgG binding epitopes, whereas hydrophobic residues could
be more important for IgE binding sites in OM third domain (Zhang &
Mine 1999).
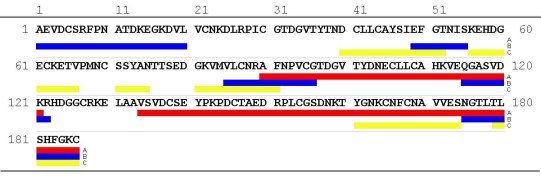 |
| Figure 6: IgE binding epitopes on the primary structure of OM. IgE binding regions derived from chemical and enzymatic cleavages (line A: Besler et al. 1999). IgE binding regions identified using synthetic peptides (line B: Cooke & Sampson 1997, line C: Mine & Zhang 1999 ). One letter code of amino acids. |
T-Cell Proliferation, Phenotypes and Cytokine Expression
Holen & Elsayed (1996) reported human T cells proliferative in
response to stimulation with native OM, LY, and OA. The cell lines were
enriched CD4+/CD8+ T cells (CD2+ > 95%). OM and OA induced IgE synthesis
by a small fraction of B cells (1%) present in the OM and OA specific T
cell lines. PBMC from 10 egg allergic patients had a significantly greater
proliferative response to OM than to OA (Eigenmann et al. 1996). Eigenmann
et al. (1996) established OM specific T-cell lines which were mainly CD3+
(of which 75-97% were CD4+ T-cells). CD8+ phenotypes were less than 25%.
Cytokine profiles of OM-specific T-cell clones were predominantly Th2-like,
with consistent IL-5 expression and variable expression of IL-4,
IFN-{gamma}, and IL-13 (Eigenmann et al. 1996)
Influence of Disulfide Bonds
The T-cell proliferative activity of "linearized" OM was examined either
by oxidation with performic acid or reduction and alkylation of OM. Both
alteration methods induced a significant increase in proliferation of PBMC
from 11 egg allergic patients as compared to stimulation with native OM
(Cooke & Sampson 1997). The authors suggested that APC (antigen presenting
cells) may have some difficulties processing the native form of OM compared
with the denatured molecule.
Domains of Ovomucoid
T-cell responsiveness of OM domains was tested by PBMC proliferation
tests in egg allergic children and adults (Tab. 3). Eigenmann et al. (1996)
and Cooke & Sampson (1997) found the highest stimulation by the third
and second domain. Proliferative response to DIII was similar to native
OM, while response to DII was lower without significant difference. Only
DI showed a significant decrease in proliferative response of PBMC as compared
to native OM (Cooke & Sampson 1997).
Table 3: Specific T-cell proliferation by ovomucoid domains
(percentage)
|
|
|
|
|
|
|
|
|
|
|
|
|
|
|
|
|
|
|
|
FUTURE PERSPECTIVES
Food allergens are comparatively resistant to heat and acid treatment,
proteolysis, and digestion (Taylor & Lehrer, 1996). In fact,
many researchers have demonstrated the heat- stability and resistance to
proteolysis and antigenicity of heat denatured OM (Stevens & Feeney
1963, Deutsch & Morton 1956, Matsuda et al. 1982). On the other hand,
the proteolytic digestion of food protein has been known to be effective
in diminishing its allergenicity. Reducing disulfide bonds in OM
has been proven to enhance its digestibility and lower allergenicity in
vitro (Kovacs-Nolan et al. 1999). Interestingly, substitution of
a critical amino acid within each of the epitopes led to complete loss
or lower IgE binding activity (Mine & Zhang, 1999). These results will
enable the design of new approaches to reduce food- hypersensitivity reactions
of OM using genetic engineering.